The right bank of Ukraine is steadily emerging as the new epicenter of national crop production. While military events have accelerated this shift, the primary driver is climate change. Agro-climatic zones are shifting, and precipitation is increasingly concentrated in the west and north, forcing a significant transformation in the country’s traditional agricultural structure. This was reported by Dengi.ua , citing an in-depth feature from Latifundist.com.
"Agroholdings will migrate to the west; it has become significantly warmer there than it was 20–30 years ago. Growing corn in Volyn or the Carpathian region used to be nearly impossible. Today, they are growing not only corn but also sunflowers and other grains," Tetyana Adamenko, head of the Agrometeorology Department at the Ukrainian Hydrometeorological Center, stated in an interview with Forbes Ukraine.
According to Adamenko, the agricultural sector has a window of roughly 7–10 years to adapt to these new conditions; otherwise, parts of the southern territories risk desertification. Despite the dramatic nature of such forecasts, the consequences of climate change are already being felt in practice.
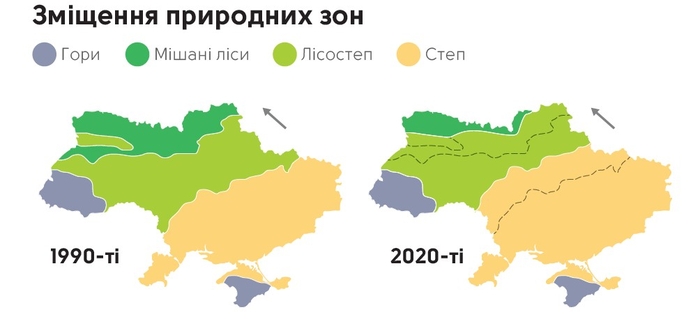
Studies indicate that the country's agro-climatic zones are shifting northward and westward, fundamentally altering the entire crop production model. Crops such as corn, sugar beets, and various oilseeds are increasingly being cultivated in regions previously considered unfavorable for them.
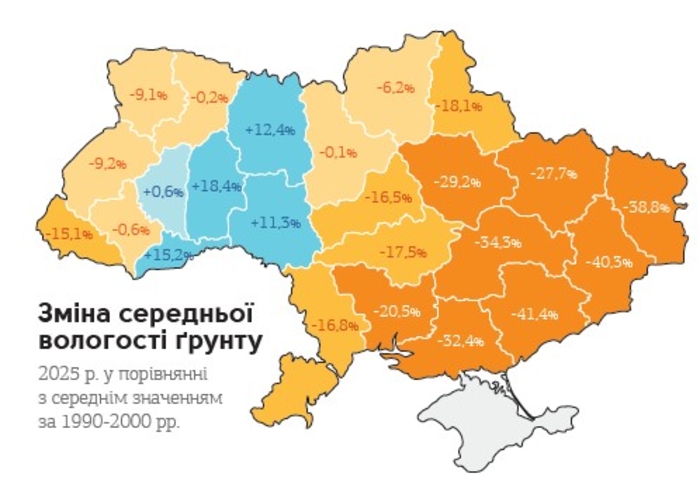
Over the last 20–25 years, Ukraine’s average annual temperature has increased by over 1.0–1.2°C, and precipitation patterns have become significantly less uniform. Right-bank regions now consistently receive 100 mm more precipitation than left-bank regions, particularly during the growing season.
Recent statistics confirm this trend: average annual precipitation reached 683 mm in the Lviv region and 657 mm in the Ivano-Frankivsk region, while in the Mykolayiv and Zaporizhzhya regions, these figures were only 449 mm and 455 mm, respectively. This disparity was particularly evident in 2024, when soil moisture maps almost perfectly coincided with grain yield maps.
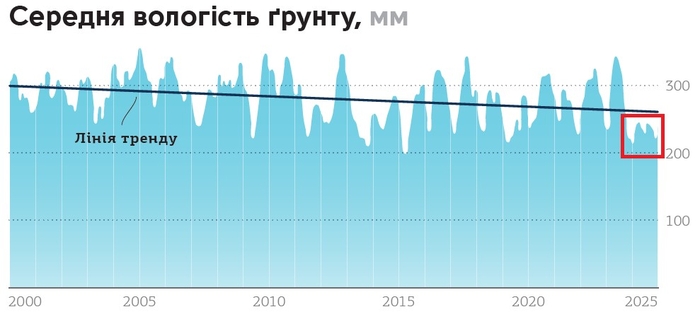
Simultaneously, not only is precipitation becoming unevenly distributed, but total volumes are gradually declining; over the past three years, annual indicators have hovered at or below historical lows.
Another sign of climate change is the shift in the timing of the autumn sowing campaign, which is increasingly postponed due to late-summer and early-autumn soil moisture deficits. Conversely, the growing season has lengthened: the number of days with average temperatures above +10°C in the central and western regions has increased by 10–15 days compared to the early 2000s. This creates both risks and opportunities, including the potential for multiple harvests per season and the introduction of new crop varieties.
While these changes may initially seem moderate, Ukraine's agrarian map has already shifted markedly. Right-bank Ukraine no longer plays a secondary role. The war has exacerbated this process, as some agricultural land in the south and east is either temporarily occupied or subject to operational restrictions.
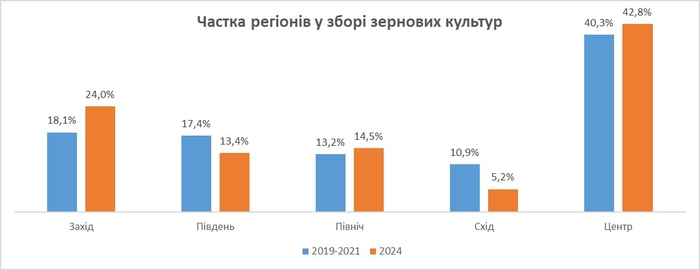
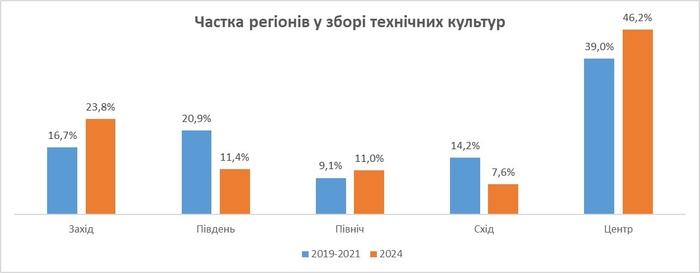
Even excluding military factors, the shift of the agrarian center would remain significant. Climatic trends are steadily strengthening the role of the central and western regions. While the northwestern cluster provided about 22% of the gross harvest of major cereals and industrial crops in 2019–2021, by 2024, its share had increased to 29%.
It is important to note that this reflects a real increase in production, rather than a mere redistribution of shares due to declining performance elsewhere. Overall, the share of the broader Right Bank region (excluding the Kyiv, Dnipropetrovsk, and Kherson regions) in total gross yields has increased from 49% to 60%.